
Steel Markets

January 2, 2014
Construction Value Put in Place (CPIP) through November
Written by Peter Wright
The Commerce Department compiles their information based on the source of financing. These categories are, private, state + local and federal. There are a huge number of sub categories in the private and state + local construction expenditure categories, not so many in federal where expenditures are minimal. At Steel Market Update we combine these sub categories in-order to produce a comprehensive report each month.
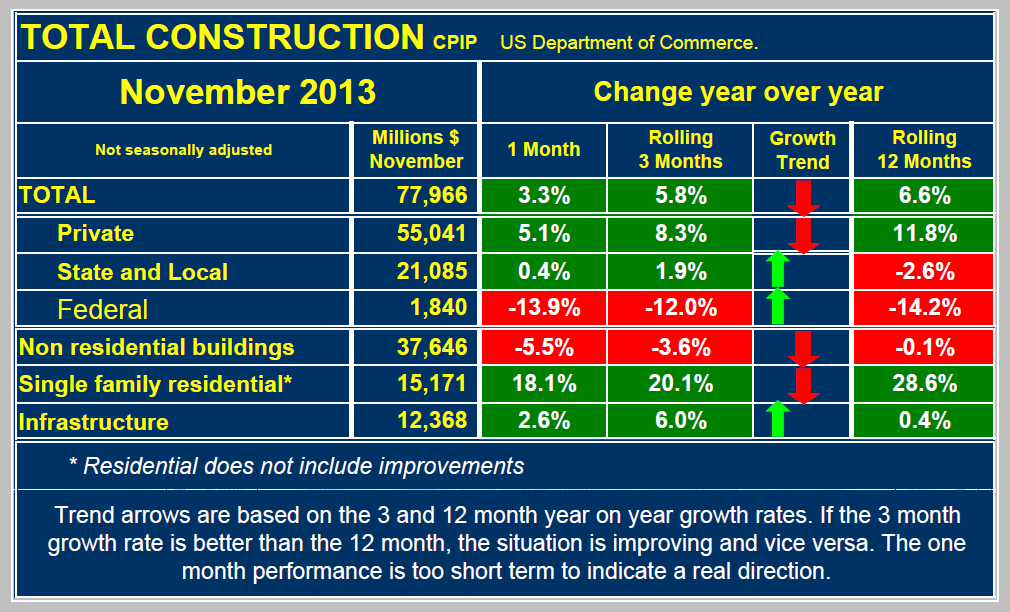
In November, total construction expenditures were $77,966 billion down by 8 percent from October but this was purely a seasonal effect. There is no point comparing construction statistics one month or one quarter after another as the results are so seasonal that such a comparison is meaningless. By financing in November, 70.6 percent was privately funded, 27.0 percent was state and local and 2.4 percent was federally financed. Of the total expenditures, 83.6 percent falls into three major categories. Non-residential buildings accounted for $37.646 billion, down 5.5 percent from November 2012, single family residential was $15.171 billion, up 18.1 percent year over year and infrastructure was $12.368 billion up 2.6 percent year over year. Table 1 shows expenditures for November with year-over-year comparisons monthly and on 3 and 12 month rolling averages (3MMA and 12MMA). Total construction in November on a 3MMA basis was up by 5.8 percent year-over-year and up by 6.8 percent on a 12MMA basis. The three month growth rate was less than the 12 month growth rate meaning that momentum was negative and growth slowed slightly in the last three months.