
Steel Markets

April 7, 2014
Construction Expenditures through February 2014
Written by Peter Wright
Each month the Commerce Department issues its construction put in place (CPIP) data on the first working day covering activity two months earlier. February data was released on April 1st.
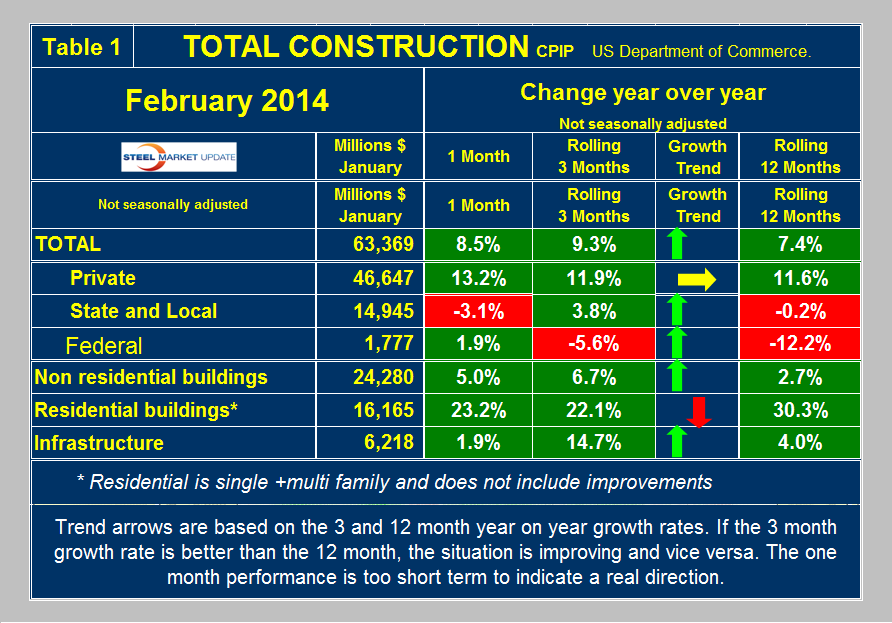
Total Construction: February expenditures were $63.369 billion which breaks down to $46.647 B of private work, $14.945 B state and locally financed and $1.777 B of federal expenditures (Table 1). Federal expenditures are declining rapidly as Washington struggles with its deficit but this construction sector is so small as to be of little interest. On a rolling three month basis total construction was up by 9.3 percent year over year (y/y) and was up by 7.4 percent on a rolling 12 months y/y. This means that total construction growth has positive momentum since the short term growth (3 months) was greater than the long term (12 months). The momentum of private construction was only 0.3 percent which we consider to be basically flat, however, state and local (S&L) work had positive momentum of 4.0 percent and positive growth of 3.8 percent in the three months through February. We consider three sectors within total construction. These are non residential, residential and infrastructure. On a rolling three month basis y/y non residential is growing at 6.7 percent and accelerating. Residential is growing at 22.1 percent and slowing. Infrastructure grew 14.7 percent y/y in the last three months showing rapid acceleration. All numbers quoted in this analysis are not seasonally adjusted. Construction is highly seasonal and for our purposes we always compare data year over year to eliminate this effect. The growth of total construction has been fairly steady for over 18 months averaging about 7.0 percent but it will be 2018 before the pre-recessionary peak is regained (Figure 1).