
SMU Data and Models

April 28, 2014
Key Market Indicators - April 28th 2014
Written by Peter Wright
One of the products which is provided to our Premium Level members only is our Key Market Indicators. Our KMI analysis is showing an improving (more positives than negatives) situation, especially in the flat rolled steel markets. An explanation of the Key Indicators concept is given at the end of this piece for those readers who are unfamiliar with it.
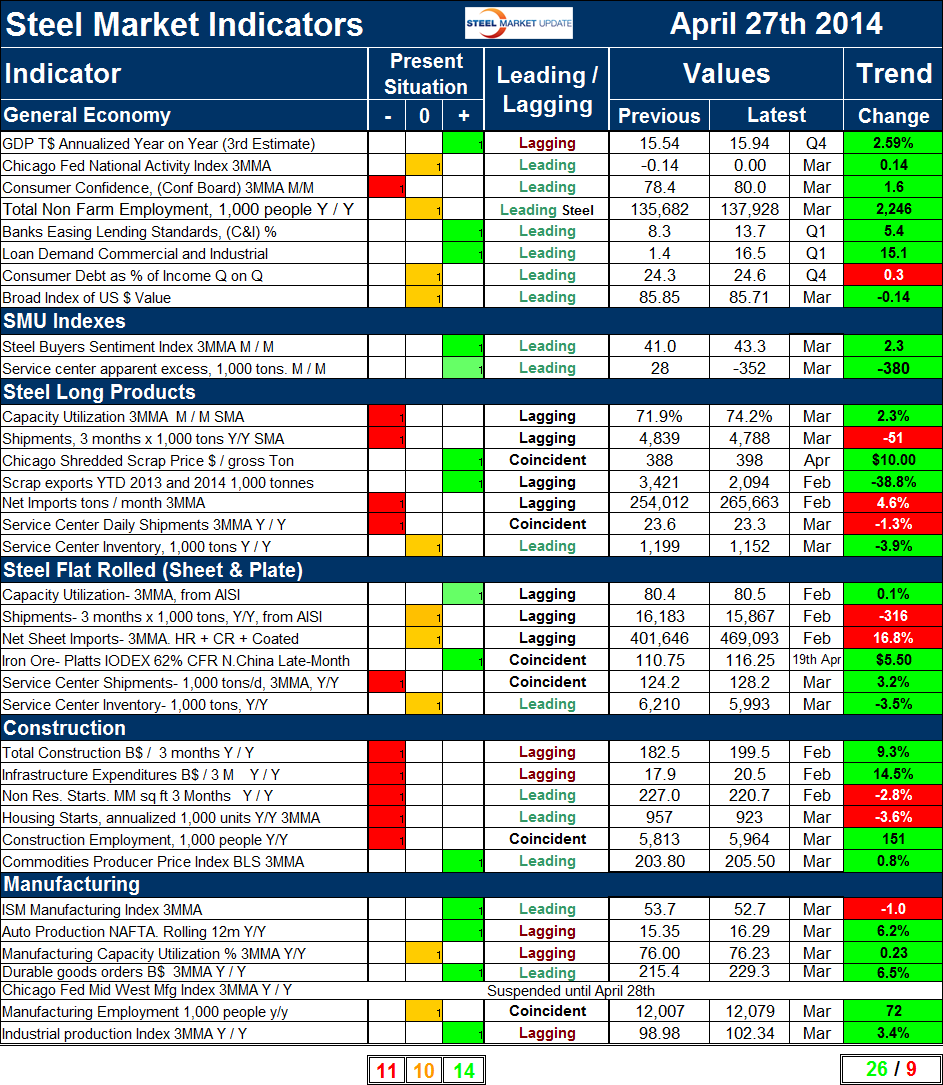
The total number of indicators considered at present is thirty five, a decrease of one as the Chicago Fed Mid-West Manufacturing Index has been put on hold until late April to enable the staff to complete a major re-vamp of the structure of their report. Please refer to Table 1 for the view of the present situation and the quantitative measure of trends. The present situation improved from last month’s analysis. Fourteen of the indicators based on historical standards were positive on April 27th and eleven were negative with ten considered to be close to the historical norm. This is the most positives and the least negatives since we began this analysis a year ago. Nine of the negative indicators were in the steel long products and construction sectors. It makes sense that these two groups would be in harmony. The general economy and manufacturing are with only one exception either positive or neutral. This broad look confirms that it is construction that is holding steel demand lower than is normal at this time in a cyclical recovery.