

Economy

April 23, 2015
China’s Economic Statistics Q1 2015
Written by Peter Wright
The graphic below shows published data for the growth of GDP, industrial production and consumer prices through the 1st Q of 2015. The GDP and industrial production portions of this graph are three month moving averages. GDP grew 7.3 percent y/y in both the 3rd and 4th quarters of 2014, declined to 7.0 percent in Q1 2015 and has been declining since Q1 2010. The most recent data was the weakest since Q1 2009, reflecting broad weakness across agriculture, manufacturing and construction. The housing slump is hurting spending in a wide range of sectors and is pressuring corporate profits, a negative for hiring and business investment. Service industries continue to grow strongly which is the declared intent of the central government.
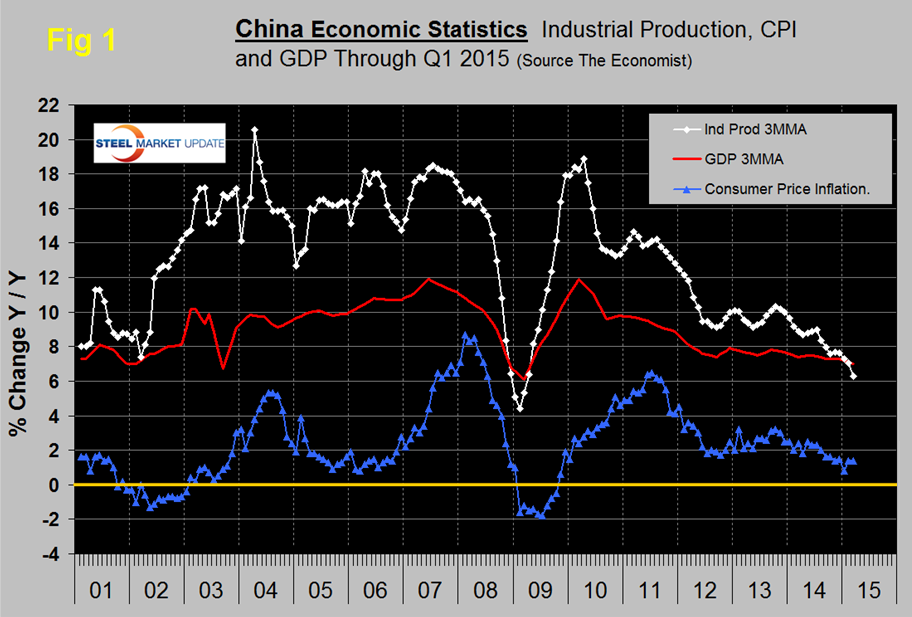
The growth of industrial production year over year on a three month moving average basis which had been averaging 16 percent from early 2003 to mid-2008 decreased in March to 6.3 percent and has declined for six straight months. The single month of March result was the lowest since February 2009 as the housing slump has cut demand for products such as metal, cement, iron, and other building products. The decline in electricity production in March mirrors the slowdown in the broader economy, as household and business energy demand is subdued.