
Economy

June 28, 2018
Indicators Remain Positive for U.S. Manufacturing
Written by Peter Wright
Economic indicators of manufacturing activity continue to look favorable for the rest of 2018. This report summarizes seven data sources that describe the state of manufacturing in the United States. We have reported on most of these separately in our Steel Market Update publications and therefore will be brief in this summary. We don’t expect these data sources to all point in the same direction. Our intent in summarizing them in one document is to provide a consensus of the state of this critical steel consuming sector. Based on American Iron and Steel Institute estimates of steel mill shipments by market classification, almost 50 percent of the steel consumed in the U.S. is manufacturing-oriented. This breaks down to about 27 percent in ground transportation including infrastructure, 9 percent in machinery and equipment, 5 percent in appliances, 4 percent in defense and about 4 percent in containers.
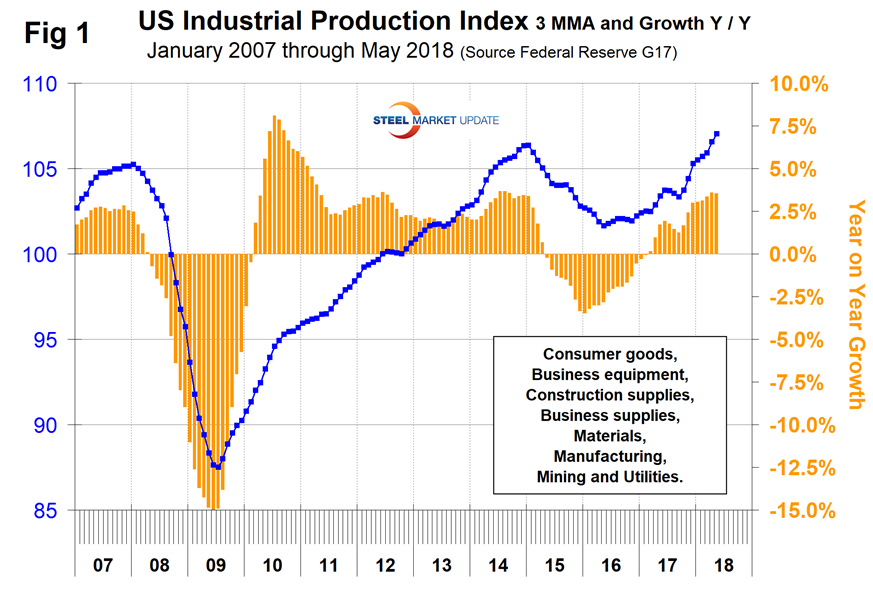
The Industrial Production Index
Figure 1 shows the IP index since January 2007 with the year-over-year growth. The three-month moving average (3MMA) of the year over year growth is shown by the brown bars in Figure 1. March 2017 was the first month of positive growth in the 3MMA since April 2015. Growth has steadily improved since September 2017. Manufacturing capacity utilization improved from 74.48 in January last year to 75.56 in May 2018, also on a 3MMA basis.